Management IT Mentoring & Coaching

Archive for the ‘Visual Mapping’ Category

Idea Mapping Webinar by Jamie Nast

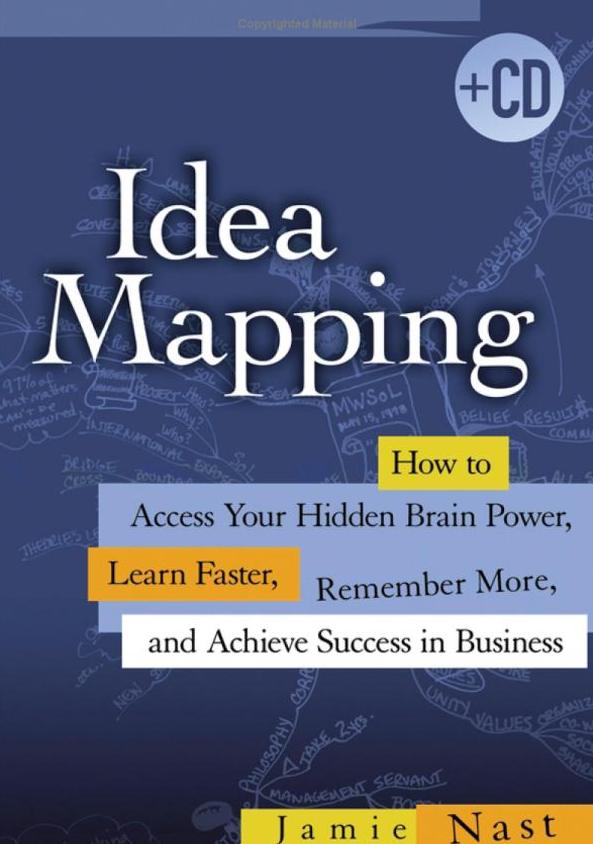
Jamie Nast (Author of Idea Mapping: How to Access your Hidden Brain Power, Learn Faster, Remember More and Achieve Success in Business) has recently posted a link to a recorded, archived, Webinar (August 2009) which I highly recommend watching.  It was delivered to nearly 900 Project Managers which hopefully dispels any thoughts that visuals are for “creative types” and not for serious project managers / data analysts.

The webinar lasts an hour (well worth your time, believe me) and  contains a full run-through of what Idea Mapping is (and how it differs from Mind Mapping) and how people can apply the skills (be it hand-drawn or via software) to enable them to visualise information to cope with that feeling of “overwhelm” which I’m sure we’ve all had at some stage.

I have read the book (more than once) and I have watched Jamie’s webinars before but every time I read or watch/listen, I realise what a brilliant idea it is to “visual data”.  If you want to see the experience that I went through when I was “converted” from being entirely linear to releasing the “visual thinker within”, then please look at the following :

Think Like a Genius – In the Mind’s Eye: https://inspiredit.wordpress.com/2010/01/21/think-like-a-genius-the-minds-eye/

Alternatively, I strongly recommend that you click this link and listen to Jamie in action whilst watching a variety of Idea Maps which really bring it all to life.

Even if you don’t use Mind Maps, the concepts Jamie will explain to you are transferable skills so don’t under-estimate them and don’t think they’re only for people who “do mind-mapping”.  For example, I now use her ideas in Microsoft PowerPoint presentations (key words, colour and imagery) and in  Microsoft Visio Diagrams (symbols to help the brain understand the key elements) – with not a mind map or idea map in sight but I am still using Jamie’s concepts.  Many people comment on how easy it is to follow my work even though I’m dealing with vast amounts of information because I seem to “bring it to life and make the complex seem straight-forward”.  If I can do it, so can everyone and I owe it all to Jamie Nast.

Watch the video and release the visual thinker within…

Mindsystems Amode V2 is launched!

Information Management + Visual ThoughtMaps + Project Plans

Must be worth downloading the Trial Version to take a closer look …

” Mindsystems Amode V2 is the latest advancement in Information Management. Have you tried it yet?

It unifies 3 core functions into one efficient work space: Linear Data, Visuals & Project Management.

Mindsystems Amode is an Information Management tool that can help you manage almost any type of information or project in a more efficient way. It is the only software of its kind to successfully combine all the most commonly used information management functions into one seamlessly integrated application.

 It’s everything you need to manage your work: – Information Management, Sorting of Data, Visually Database your Info – Create Graphics, Visuals & Diagrams to help explain your Information – Gantt, Project Planning & Resource Management – Schedule Management with Mobile/Cell Phone and Email Alerts – Advanced Import / Export & Presentation Modes Mindsystems Amode strikes a balance between visual presentation of information and linear practicality.”

 Bridge the gap between the fluid nature of your thoughts, and the linear structure required by the world in which you work. Mindsystems Amode will help you manage your work day, complete projects sooner and make better decisions by providing you with information clarity. “

Method Neutral: MindSystems Amode

I have recently read a fascinating Interview (Monday, October 26, 2009) by Wallace Tait with John England.  Here’s an extract…

” John England the founder of Mindsystems is the consummate professional. I [Wallace Tait] have known John for a relatively short span of time, and in this period he has indeed enabled me to glean much from his illustrious past relating to his careers. John has worn a few hats, and has performed his tasks with great success to the nth degree of professionalism. His initial business success has enabled both him and his team to create a strong Mindsystems presence within the business management arena. Mindsystems have developed a new concept called “Method Neutral”. Once you get your head around this, you’ll receive an “aha” moment for sure; I know I did; so read on and receive yours.

…Tell us about your involvement and work at Mindsystems?

I am the executive director and founder of Mindsystems which means …  that I can spend my time in more innovative and entrepreneurial ways than I was able to in the past. My major focus these days falls into three distinct yet overlapping areas: making new industry contacts, focusing on developing Amode .and constantly researching new trends in information handling. 

…Tell me about the “Method Neutral” approach you now take to software design

Method Neutral is described as “multiple modes of information expressed within a flexible workspace”. We developed the Method Neutral concept in response to our frustration towards the “one size fits all” approach of many software companies. For example there are those that would have you believe that the mind map is the centre of the universe. I would suggest that the true centre of the universe is not mapping (or any other particular technique) but rather the information itself. … It is quite easy to reach a point where the information is hidden behind the technique of mind mapping. Quite simply large maps are very difficult to manage even when filtering techniques are applied to the map. This led us to the Method Neutral approach to software development. …

…You recently developed a new information management product called Amode; tell us about it and what it can do for us?

Mindsystems … Amode V1 was launched in May 2009 and received a very enthusiastic reception. We are now well into the development of Version 2. The really significant part of the development was an almost fanatical application of Method Neutral. Another principle which was kept in mind was the model of Chaos Theory. This theory does not really say that the world is in chaos, but rather we are surrounded by a great deal of data and information in random and constant motion and that from time to time patterns (emerging trends) form. Thus Amode is designed to handle information in a neutral way and make the identification of patterns simple and straightforward. What is so important about these patterns … well two things: First the identification of “knowledge” and second the identification of emerging commercial trends … in fact staying ahead of the curve!

… Method Neutral, IMO, as a new concept and definition shall undoubtedly impact the information management arena; how will it impact information handling?

You’re quite right in saying that this concept and its definition of information handling are set to have a big impact on people’s perception of the way in which information should be handled and its importance in the systems approach. … The Method Neutral [approach]… “multiple modes of information expressed within a flexible workspace”. I have been amazed at people’s reaction to this simple concept in that almost everyone seems to have one of those “Aha” moments when they suddenly “get” the critical concept that the information is the centre of the universe and not the presentation technique. I fully appreciate that we will meet considerable opposition from those entrenched in a particular visual presentation process, be that as it may, our experience and people’s reaction to this concept leads me to believe that it will be the way of the future for information handling.

… What are the capabilities of your product?

Mindsystems Amode allows you to work in a logical and structured way.  Mindsystems Amode combines visual planning, information handling, project management & multi-task management all in one tightly integrated application.

• Manage & organize information visually
• Robust Information Handling System
• MS Office® / Open Office Integration
• MS Project and MS Outlook Integration
• MindManager integration
• Full Project Management, Gantt Charting
• Powerful Filtering & Searching
• Alarms, Notes, Embed Attachments
• Work in groups in real time

Above all Amode allows the user to focus on Information and Process in an uninterrupted, elegant and intuitive manner.

… What do you see in the field of visual mapping as trends going forward?

Another very good question Wallace and one which I know is dear to your heart. I believe we have come to a fork in the visual mapping highway. One group will vehemently defend the pure visual approach (of which mind mapping is a perfect example) while others accept the inevitable conclusion that must be drawn when considering and using the Method Neutral approach. …

For the full interview visit Wallace Tait’s VisualMapper blog

… and, finally, watch this space because MindSystems Amode v2 is on the way…

Think Like a Genius … The Mind’s Eye

I originally posted this on my former blog in August 2008 and have re-posted it here…

I have recently read “Overcoming Information Overload” by Tina Konstant & Morris Taylor, which is part of the Instant Manager series from the Chartered Management Institute.

I particularly enjoyed the section on “Think Like a Genius“…

“Geniuses like Newton or Archimedes didn’t simply sit under trees or in a bush until they became enlightened.  They used some very powerful and practical tools to create order out of their thoughts and to find answers to problems that few people ever thought existed, let alone considered solving.

Some factors common to the world’s greatest thinkers:

– Idea generation is in pictures and images rather than words. 

– Einstein and da Vinci drew diagrams instead of writing words and sentences.

– Their thinking is unrestrained; nothing is rejected until it has been fully investigated.

– Ideas are explored using association.

– They fuel their imaginations with knowledge.

– They never give up”

Tools for generating genius thinking

Mapping  … it is worth talking about information mapping.  ‘Mind Mapping’ was formalised and labelled by Tony Buzan in the 1970s.  Great thinkers have used similar techniques for centuries.  Leonard da Vinci, Albert Einstein and Thomas Edison, like other geniuses, represented their ideas through diagrams and ‘maps’.

You might know them as spider-graphs or thinking maps, but whatever you call them, they all have the same features:

– pictures instead of words

– links between relationships

– main concept in the middle, gradually becoming more detailed towards the end of branches

– single words or ideas per line

– colour”

The reference to da Vinci reminded me of some of the fantastic drawings and sketches that I saw many, many years ago in the National Gallery – until then, I hadn’t realised that he was an inventor (I was completely shocked that he had invented a flying machine that we’d recognise as a helicopter!), a sculptor, a mathematician, a botanist, an architect …

… I had thought he was an artist, famous for the Mona Lisa. 

The extent to which he had drawn images to represent thoughts and details really surprised me.  The picture below is a study of perpetual motion.

The V&A Museum has some excellent articles about his work on their website, including:-

The Mind’s Eye – The Measure of All Things

“For Leonardo, sight was the noblest and most certain sense. It provided access to “experience”, which shows us how nature works according to mathematical rules. Any knowledge that could not be certified by the eye was unreliable.

He investigated the relationship of the eye to the brain. He proposed a system in which visual information was transmitted to the intellect via the receptor of impressions and the “common sense”, an area where all sensory inputs were coordinated.”


I now realise that visual imagery is the best place for thinking things through … but it took me quite a while to make the connection.  For that, I will always be grateful to Jamie Nast, author of Idea Mapping

It was Jamie who helped me realise that colour and images help the brain to think better, quicker, clearer and to remember better. 

Visual Thinking & Project Management is a topic close to my heart (the combination of VISION and DETAIL) but I really hadn’t realised that Leonardo da Vinci had investigated the relationship between visual information and intellect

If it was good enough for da Vinci … I’ll continue to explore the tools at my disposal …

Harness your Visual Creativity

I first posted this in November 2007 on my former blog but feel it merits re-posting here…

With kind permission of both Mindjet and Jamie Nast herewith an extremely interesting Personal Interview with Jamie Nast, Author of “Idea Mapping”

jamie_nast.jpg 

Mindjet : Maps use both verbal and numerical information, and combine these with the power of creative intelligence; how do maps specifically allow one to think creatively?

Jamie Nast : Maps tap into all of the cortical skills, which are housed in the right and left sides of the brain. The concept of right brain/ left brain thinking developed from the research of American psychologist Roger Sperry in the late 1960s. The right brain is dominantly represented by color, imagination, daydreaming, rhythm, and spatial skills, while the left brain by verbal, mathematical, lines, sequence, lists, logic, and analytical skills. It’s a myth that creativity rests on the right side alone– it’s right combined with left that maximizes creativity, and nothing does that better than an idea map. A map reflects the natural way our brain associates information.

Maps pull information together onto a single sheet of paper in a way that leverages one more area of dominance found on the right side of the cerebral cortex. It’s called gestalt (German for the whole picture) where one sees each topic, each branch, and how the various pieces of data interrelate and connect. A map is a visual picture that enables people to see the relationships between data points, see everything in one place, and now be able to step back and think, clarify, analyze, prioritize, (re)organize, or innovate– and then take action. A map is a tool that provides a framework that fosters and can lead to new ways of thinking. Now that’s creativity!

MJ : What do you do to think creatively?

JN : I can get overwhelmed and immobilized by the large amount of tasks that I need to juggle. The only way I can function is to put everything in a map. It may not be the most creative example in the world, but for me it is a creative solution. The outcome and benefit to me is that my mind is now free to think rather than worrying about trying to manage all the plates that are spinning.

Another example is when I write a book or an article. Right now I’m considering two different book angles, and using MindManager in both scenarios to generate 100% of my creative thinking. The maps are used for gathering research, tracking potential contributors, determining possible endorsements, and outlining chapter headings. The process itself can be creative, but it’s the ability to step back and look at the gestalt— that’s where the creative process takes action.

MJ : What’s a coaching or teaching example of thinking creatively?

JN : Every single time I teach I use MindManager. There was a time in 1996, when I was supposed to teach a 4-day workshop on Stephen Covey’s The 7 Habits of Highly Effective People. I wasn’t at all prepared, and it had been 9-12 months since I’d been certified. We were teaching the first day to two different groups on back-to-back days. So I struck a deal with my teaching partner. She taught the first day, during which I took detailed notes in a map so I could teach the same material to the second group on the following day. I didn’t have the software at the time, so for me it was a creative alternative to spending two weeks absorbing information from a four-inch thick manual.

jamie-7-habits.gif

I taught the entire day from a single 11”x17” map. The participants didn’t know that this was my first class, and were extremely receptive to the use of the map. If I hadn’t had the map, I literally would have had to read from the book in order to teach the class. Now I use them all the time. Maps capture the big picture and provide creative flexibility in terms of having options on content. If there’s extra time, I have a branch for what I may add, or what to take out if there’s not enough time. In preparing for the June 5th webinar, I went through the creative process with a map to determine what I wanted the audience to walk away with and how to maximize that hour. 

jamie-nast-memorability-factor-map.jpg 

MJ : Your June 5th webinar The Memorability Factor showed attendees how the visual aspect of mapping increases their own memories and those viewing their maps; how is this thinking creatively?

JN : The simple act of creating a map can be creative – it’s colorful and full of imagery. An image can portray a thought in a way that’s beyond words— and it makes the whole process more enjoyable. If something is fun, it’s more memorable. Even something as simple as using different colors for the various branches can enhance one’s ability to make associations and promote a greater level of creativity. A key client who took my class about ten years ago created two different maps on a topic— both had the same content, but one had images and the other didn’t. She conducted a comparison and found that most people preferred the one with images because it was much more interesting. Images break up the monotony of words and thus stimulate one to think and make connections that might otherwise go unnoticed.